.gif)


-
 Getting started
- File management
- Viewing Data
- Labelling Data
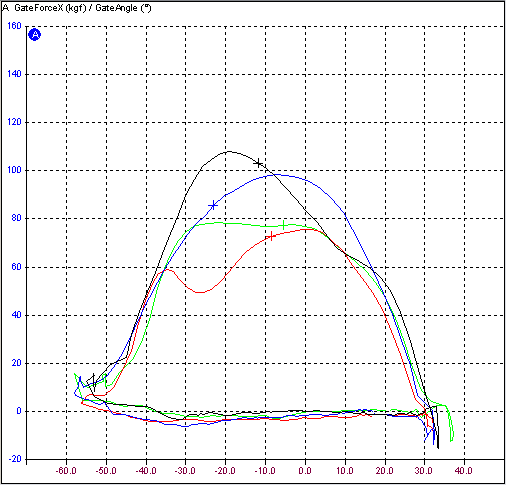
XY view
An XY View enables two channels to plotted against each other. Periodic channels can be plotted against each other, and aperiodic channels can be plotted against each other. The only limitation is that periodic channels cannot be plotted against aperiodic channels.
Some examples of graphs are:
- gate force vs gate angle
- gate force vs normalised time
- average speed vs rating
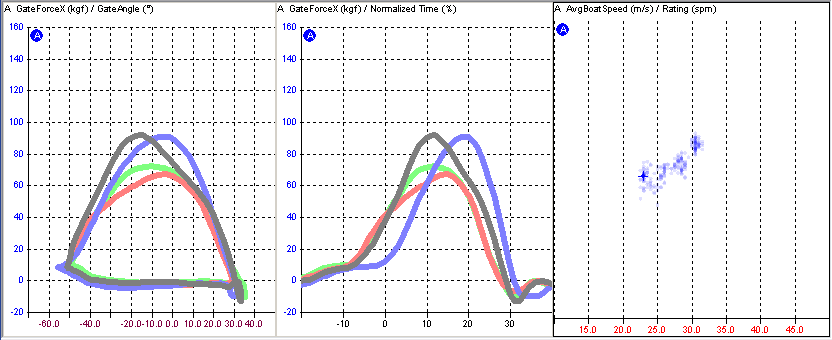
Note that the plotting against normalised time enables a view where curves are placed very consistently regardless of rating.
Channel selection
The configuration dialog shows a list of channel pairs which will be graphed.
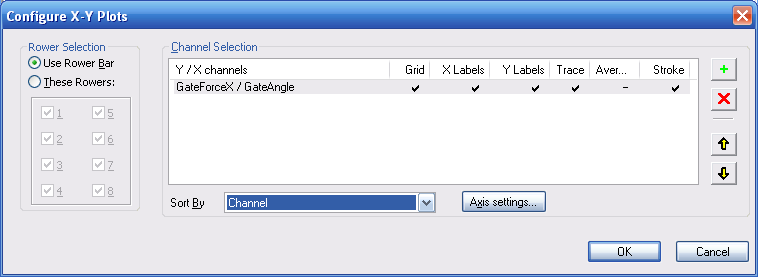
- to add a pair of channels, click on the green + button. A dialog comes up enabling you to select the channels to be used for the X and Y axes. If you wish to add a channel that wasn't logged in that session, click on Show all channels check-box.
- to remove a channel pair, select it by clicking on the channel name, and clock on the red x button
Plot order
Each XY View will contain one or more graphs, depending on the number of channel pairs selected and the grouping determined by the drop-down 'Sort By' box:
- 'sort by channel' means that each channel pair is assigned a graph
- 'sort by rower' means that each rower is assigned a graph, and all the non-rower channel pairings will be bundled together on a separate graph

The graphs are laid out in the pane in rows and columns, and will vary according to the proportions of the pane's height and width. The order in which the graphs are plotted can be changed by reordering the channel pairs using the Up and Down arrow buttons.
Display options
Each channel has options for displaying additional information. To bring up these options, either double click on a channel name, or highlight a channel and click on the Axis settings... button.
- 'Show Grid' - superimposes horizontal and vertical dashed grid lines
- 'Show X Labels' to display the values for the tick marks on the X axis
- 'Show Y Labels' to display the values for the tick marks on the Y axis
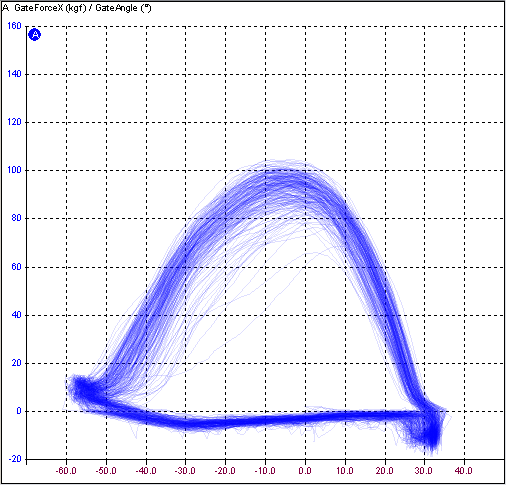
- 'Show XY Trace' - to display all the data in the currently selected region. For periodic data (i.e.. 50Hz traces) this is plotted as a feint line. For aperiodic data (e.g. stroke-by-stroke data) this is shown as a series of dots.
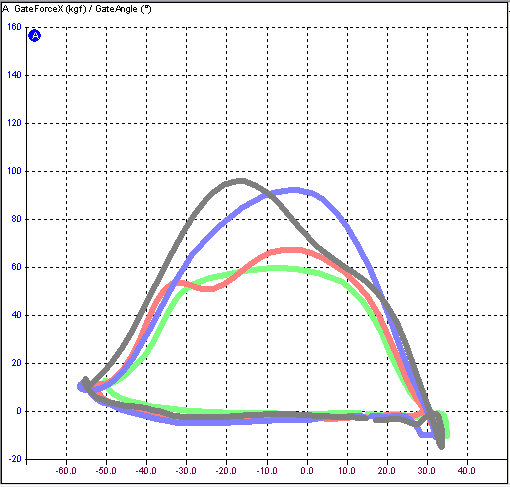
- 'Show XY Average' - to display a time average of all the data in the currently selected region. This is shown as a wide line of medium colour density.
- 'Show Current Stroke' - to display the data from the current stroke as a thin line.
As a keyboard shortcut, the settings for each of these may be toggled by pressing CTRL-G(rid), CTRL-X( labels), CTRL-Y(labels), CTRL-T(race), CTRL-A(verage) or CTRL-C(urrent stroke).
Note that any of the above can be selected in any combination. If, for example, you select the XY Average and the Current Stroke to be shown, then there will be an overlay of a wide line with the data from the current stroke overlaid on top.
If a graph contains more than one channel that contains the same scaling (e.g. in a sculling boat, the port and starboard channels for force), then it reduces the amount of clutter in the display if only one of them has X and Y labels selected.
Rower selection
The configuration dialog also determines which rowers' data is shown. In the 'Rower Selection' area of the dialog, you may set whether the pane shows data for all those rowers selected in the Rower Bar, or you can force it to show data for specified rowers.