.gif)


-
 Getting started
- File management
- Viewing Data
- Labelling Data
Profile view
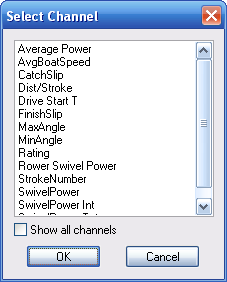
A Profile View can be used to display any channels which are sampled aperiodically - for example all the channels which are sampled once per stroke, such as power, rating and average boat speed.
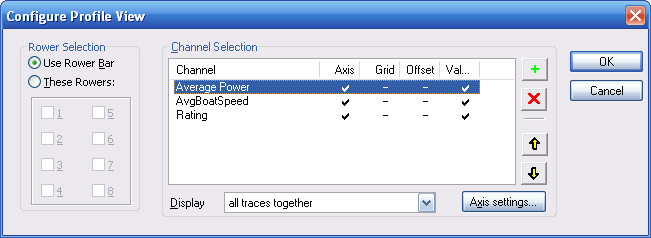
Channel selection
The method of configuring a Profile View is identical to the method for a Trace View, only by default only aperiodic channels are available for display.
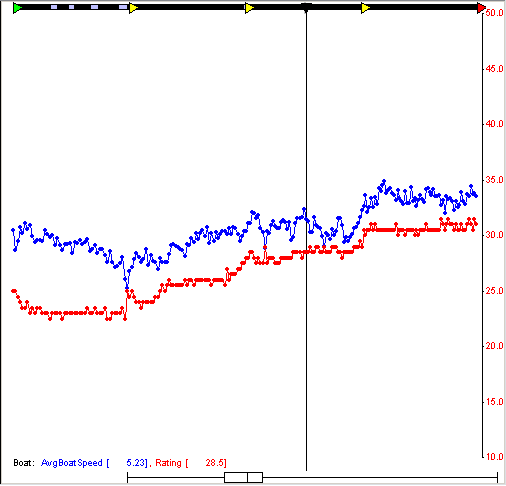
X-axis
The X-axis is not labelled. However, a graphic at the bottom of the Profile View represents the duration of the whole session as a line, and the cursor position and the width of the Profile View as a line and a rectangular box that travel up and down the line.
The position of the Profile View within the session can be manipulated by dragging the rectangular box to left and right.
The Profile view can be zoomed in and out by use of the keyboard shortcuts < and >. Additionally, the Profile View is automatically zoomed to the width of an interval when that interval is double-clicked in the Session Window.
Note that all Profile Views share the same X-axis settings.
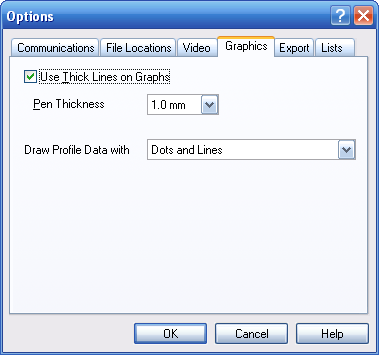
Graphics
There is a choice for how the graphs in the Profile Views are drawn. Select Tools→Options→Graphics to select from:
- dots
- lines
- dots and lines