.gif)


-
 Getting started
- File management
- Viewing Data
- Labelling Data
Color Map view
The Color Map view displays periodic data for a selected region plotted against time. Data for each stroke is centred in the first acceleration zero crossing point for each stroke drive and the data for each stroke is drawn from bottom to top, one on top of the other.
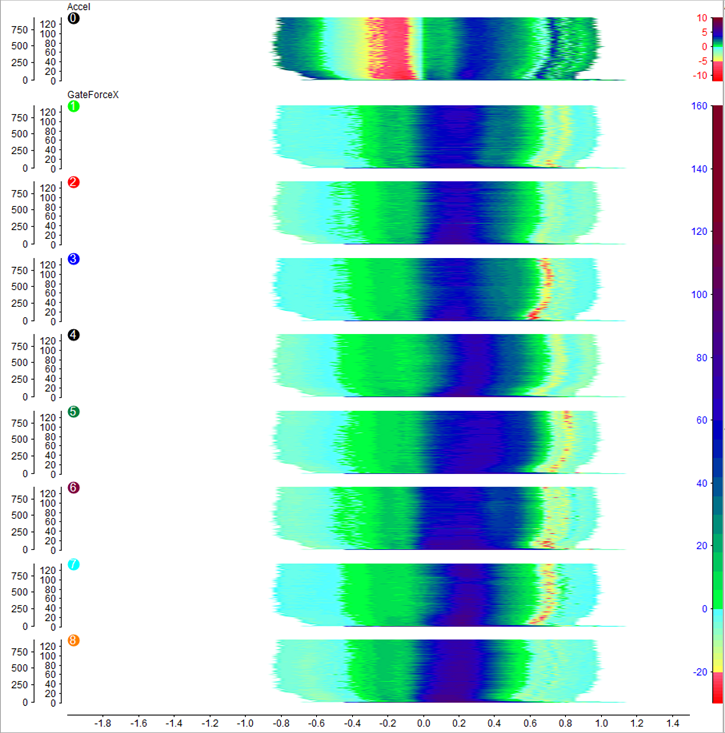
The configuration dialog shows a list of channels which will be graphed.
Note that compared to other views there will be a graph for each rower and each channel.
Selecting channels
To add a channel, click on the green + button. A dialog comes up showing the list of channels available for that session. If you wish to add a channel that wasn't logged in that session, click on Show all channels check-box.
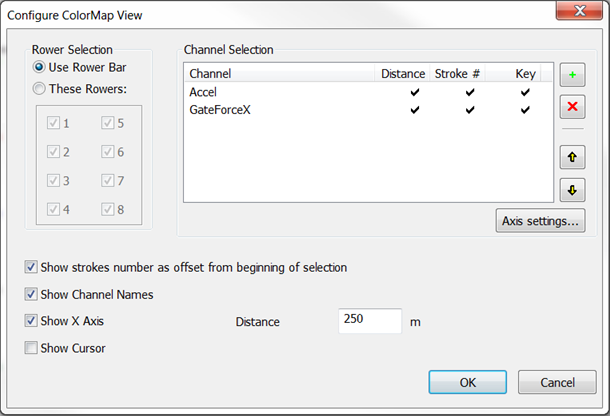
To remove a channel, select it by clicking on the channel name, and clock on the red x button.
Display order
A color map view can contain more than one graph. The order of the channels in the dialog box determines the order in which they are displayed in the Color Map View from top to bottom. The order of channels can be changed using the Up and Down arrow buttons. If it is a rower channel it will display a graph for every rower in the rower selection box in increasing order.
Display options
Each channel has options for displaying additional information. To bring up these options, either double click on a channel name, or highlight a channel and click on the Axis settings... button.
- 'Distance' - to display a Y distance axis for each graph as offset from the beginning of the selected region.
- 'Stroke #' - to display a Y stroke number axis showing the number of the strokes as in the file.
- 'Key' - to display a color key bar for each channel showing the color boundaries defined for the selected Color Map.
As a keyboard shortcut, the settings for each of these may be toggled by pressing CTRL-D, CTRL-S or CTRL-K.
The following additional settings are also available:
- 'Show strokes number as offset from beginning of selection' - to start counting the strokes from 0 from the beginning of the region.
- 'Show Channel Names' - to display the name of the channels.
- 'Show X axis' - to display the X axis.
- 'Distance' - to adjust the interval to divide the Y distance axis.
Rower selection
In the 'Rower Selection' area of the dialog, you may set whether the pane shows data for all those rowers selected in the Rower Bar, or you can force it to show data for specified rowers.
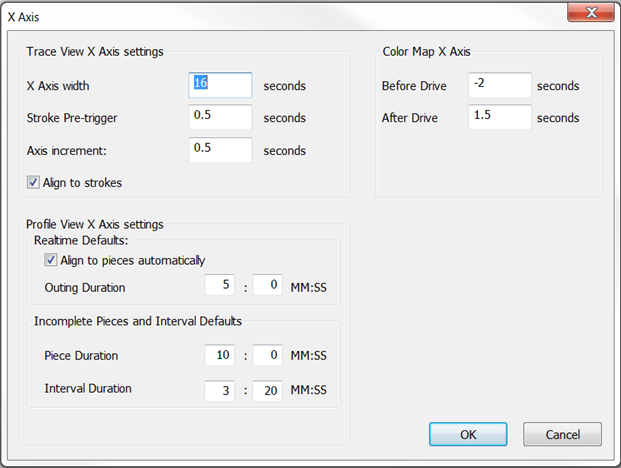
X-axis settings
The Color Map X-axis is labelled in seconds and you will be able to change the width of the axis by adjusting the Before Drive and After Drive number of seconds.
Full control of the X-Axis can be set up through a dialog. To bring this up:
- right-click on a pane and select Configure→X-axes
- or Configure→X-Axes from the menus