.gif)


-
 Getting started
- File management
- Viewing Data
- Labelling Data
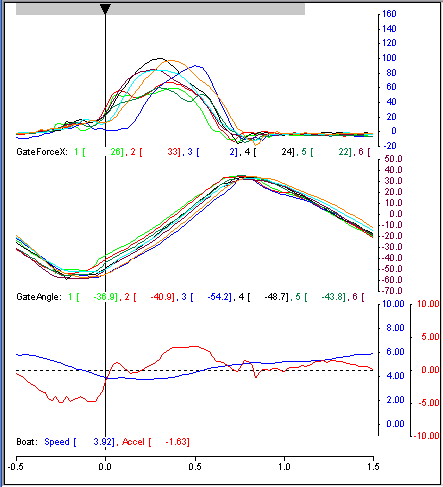
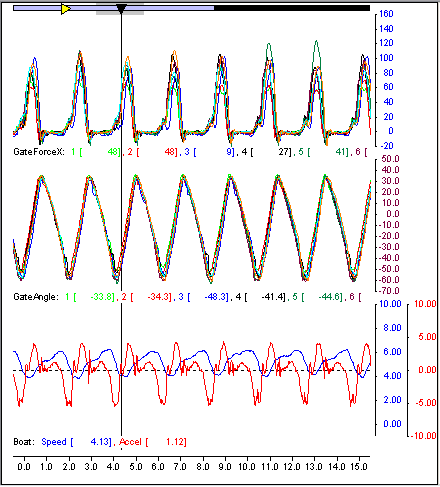
Trace view
A Trace View displays periodic data (i.e. the 50Hz sampled channels) plotted against time.
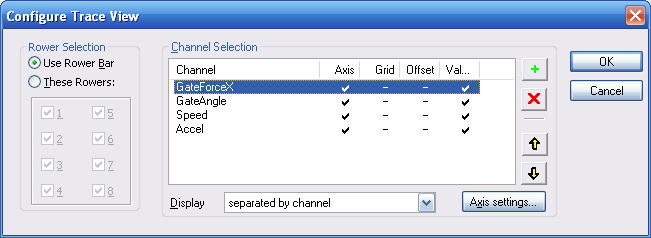
The configuration dialog shows a list of channels which will be graphed.
Selecting channels
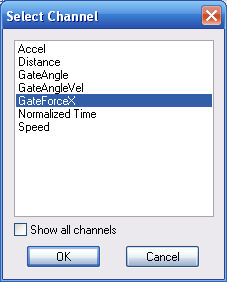
To add a channel, click on the green + button. A dialog comes up showing the list of channels available for that session. If you wish to add a channel that wasn't logged in that session, click on Show all channels check-box.
To remove a channel, select it by clicking on the channel name, and clock on the red x button
Display order
A trace view can contain more than one graph, and each graph may contain more than one channel. The way in which the channels are grouped is determined by the drop-down 'Display' box:
- 'separated by channel' means that each rower channel is assigned a graph, and all the boat channels are bundled together on a separate graph.
- 'separated by rower' means that each rower is assigned a graph and all the boat channels are bundled together on a separate graph
- 'all traces together' means that there will be one graph only with all the channel superimposed.
The order of the channels in the dialog box determines the order in which they are displayed in the Trace View from top to bottom. The order of channels can be changed using the Up and Down arrow buttons.
Display options
Each channel has options for displaying additional information. To bring up these options, either double click on a channel name, or highlight a channel and click on the Axis settings... button.
- 'Axis' - to display a Y axis labelled with grid markers
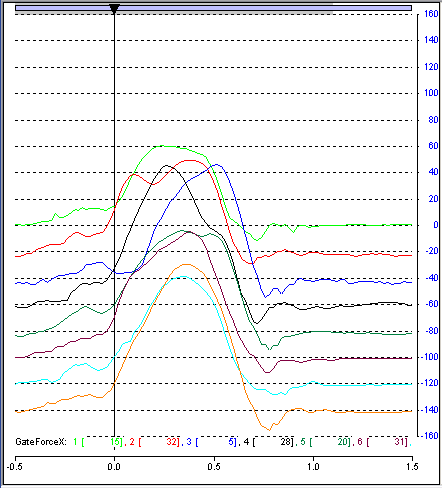
- 'Grid' - superimposes horizontal dashed grid lines
- 'Offset' - where data is 'separated by channel', then the data for each rower is offset by one grid marker. In this case, the values of the Y-axis correspond to the channel for rower #1.
- 'Values' - displays the current value of the channel (i.e. at the cursor position) below the graph. It is shown in square brackets [] next to a label for the channel name or rower number.
As a keyboard shortcut, the settings for each of these may be toggled by pressing CTRL-A, CTRL-G, CTRL-O or CTRL-V.
If a graph contains more than one channel that contains the same scaling (e.g. in a sculling boat, the port and starboard channels for force), then it reduces the amount of clutter in the display if only one of them has 'Axis' selected.
Rower selection
In the 'Rower Selection' area of the dialog, you may set whether the pane shows data for all those rowers selected in the Rower Bar, or you can force it to show data for specified rowers.
X-axis settings
The X-axis is labelled in seconds. There is an option to force the trace view to automatically align to the current stroke. In this instance, the start of the stroke (as determined by the first rower's force to exceed the catch threshold) is positioned at '0 seconds', and a short period - the 'Stroke pre-trigger duration' - is included to the left.
Full control of the X-Axis can be set up through a dialog. To bring this up:
- right-click on a pane and select Configure→X-axes
- or Configure→X-Axes from the menus
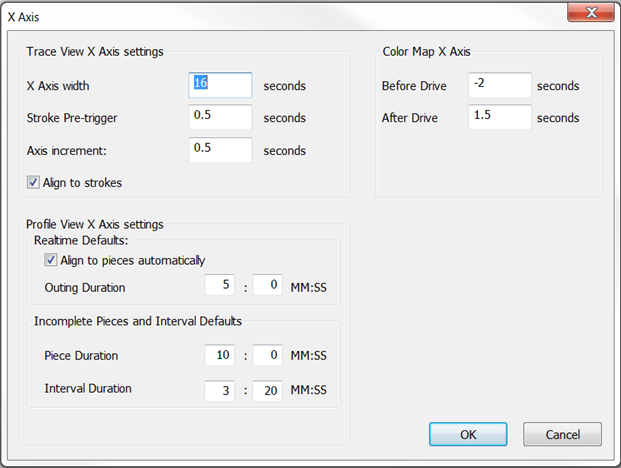
This dialog contains settings for:
- X-axis width (in seconds)
- Stroke pre-trigger threshold (in seconds)
- Axis increment (i.e. the minimum increment in X-axis labelling)
- a check box to force the trace view to align to strokes
Additionally, the width of the X-axis can be changed by zooming in or out (keyboard short-cuts '+' and '-'), and the 'Align to Strokes' feature can be accessed from the View menu.
Note that all panes configured as Trace Views share the same settings for the X-axis. They cannot be configured independently.
Other display features
The trace view displays other features along the top of the pane:
- interval markers. Start, Stop and interval markers are displayed as green, red and yellow flags.
- stroke boundaries. A wide pale grey strip indicates the extent of the stroke that the cursor is currently positioned on. Any stroke related data (e.g. rating, power) will derive from data in this region.
- video synchronisation region - if video synchronisation is available, then it is indicated with a narrow grey strip.
- selected region - the time interval set as the 'selected region' is shown by a wide black strip.
Line width
By default, the graphs are drawn in a thin line, just one pixel wide. This is best for clarity and for maximum drawing speed. If greater visibility is required, then the width of the lines can be increased:
- select Tools→Options→Graphics to choose a setting between 0.5 and 2.5mm.
Once a line width has been selected, it can be toggled on and off using View→Thick Lines on Graphs.
Thick lines are particularly useful when running real-time telemetry. However, the display may appear to run very slowly if there are many graphs on display.