.gif)


-
 Getting started
- File management
- Viewing Data
- Labelling Data
Statistics view
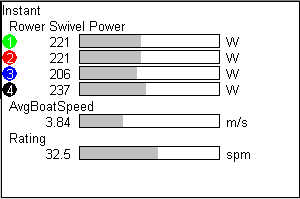
The Stats View can shows channels in either graphical or numerical form. It is set through its configuration dialog.
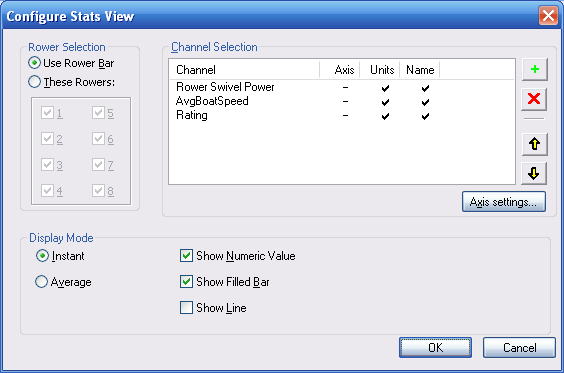
Channel selection
Any aperiodic channel can be selected to be displayed. Use the green + button or the red X button to add or remove channels. The channels are displayed in the order in which they are listed. This can be changed by moving the channels up or down the list using the up and down-arrow buttons.
Where a rower channel is selected (e.g. Min Angle), then the data is displayed for each rower, starting from 1. The choice of rowers depends on the Rower Selection, either to be drawn from the Rower Bar, or fixed so a set of rowers.
Display mode
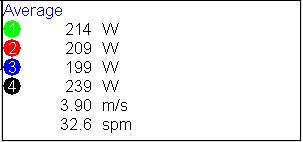
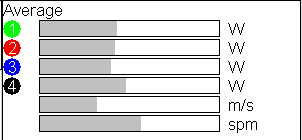
The Display mode - 'Instant' or 'Average' - determines whether the view shows the data for the current stroke (i.e. the one where the cursor is positioned), or an average for all strokes contained in the selected region.
Display options
The following display options are available:
- Show Numeric Value - shows the value as number
- Show Filled Bar - shows the value as a bar within a rectangular outline - the width of the outline is determined by the min and max values for that channel's scalings. If the displayed value is less than the scaling minimum, then the outline will appear empty. If the value exceeds the scaling maximum, then the outline will be completely filled by the bar.
- Show Line - the current value is shown as a vertical line positioned within a rectangular outline.. As for the Filled Bar, the width of the outline is determined by the channel's scaling.
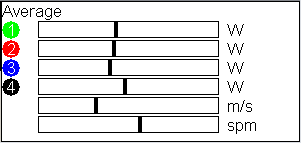
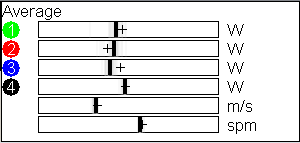
If the display mode is 'Average', then the following additional graphics can be superimposed on the Show Line:
- Show Scatter: every value within the selected region is shown in a feint colour. The tighter the data is packed together, the darker the scatter will appear.
- Show Current Value: the current value - i.e. the value for where the cursor is positioned - is displayed as a cross-hair.
Rower selection
In the 'Rower Selection' area of the dialog, you may set whether the pane shows data for all those rowers selected in the Rower Bar, or you can force it to show data for specified rowers.