.gif)


-
 Getting started
- File management
- Viewing Data
- Labelling Data
Scales and colours
To change the scales and colours of channels, either right click on a pane and choose Configure→Scales, or click on the Scales toolbar button.
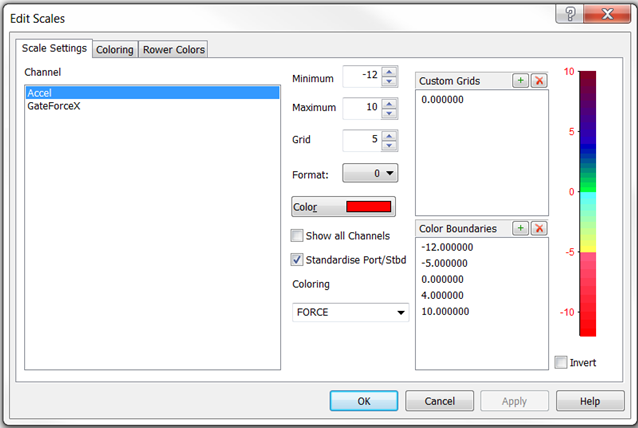
All channels featured in the selected pane are shown, together with their individual scalings:
- Minimum value - the maximum value displayed on any graphs
- Maximum value - the maximum value displayed on any graphs
- Grid - the spacing between tick marks on the axes
- Format - the number of decimal places used when displaying a value
- Color - the colour used the channel is featured in a graph that is 'sorted by rower' - i.e. when several channels for one rower are overlaid on a single plot.
Note that you will be able to invert the scalings by checking the box below the scale axis.
If the channel you wish to alter is not in list shown, you can bring up all the channels by checking 'Show all Channels'.
If the channel you are changing is a sculling channel that exists for both Port and Starboard sides, then by checking 'Standardise Port/Stbd' any changes made to the Port channel will be applied to the Starboard channel and vice versa. This is the default.
Grid lines
The Custom Grid enables a channel to have one or more horizontal grid lines defined that will be drawn on graphs. Any values defined here will be drawn as grid lines regardless of whether gridline are enabled for the graphs themselves. This could be used, for example, to set a grid line at 0 for an accelerometer, or at target maximum and minimum values for the gate angles.
- To insert a grid line, press the INS key on the keyboard and enter the desired value
Color Boundaries
Create some colour keys for each channel. Choose a Color Map from the drop-down list which will include the Color Maps created in the second tab on the Scales Dialog and define the boundaries for the colors in the Map. Note that you will be able to use the same Color Map for different channels but the boundaries will have to be defined for each channel.
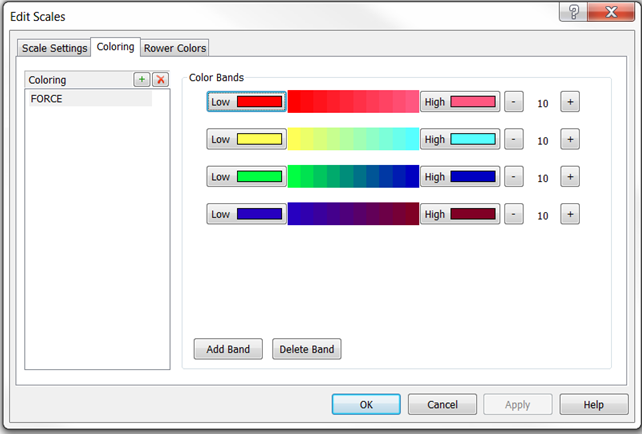
Color Maps
The second tab on the Scales dialog enables creating color Maps from a number of color bands. The colors in each band can be adjusted and you can add as many bands as you want to each Color Map. You can change their order just clicking and dragging on them. Deleting will only be allowed for the last band in the list.
These colour maps will be available then in the drop-down list in the Scales Settings tab where you will be able to define the colour boundaries for each channel.
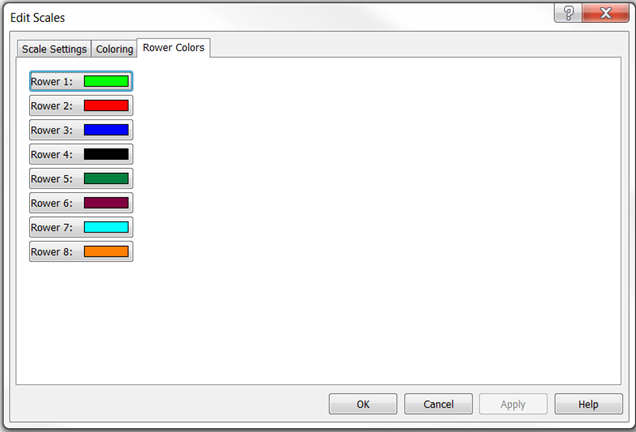
Rower colours
The third tab on the Scales dialog enables Rower Colors to be defined. On a graph where one channel is plotted for several rowers, the channel is drawn multiple times in the rower colors. The rower colors also appear alongside bars in Stats Views and as labels on XY plots.