.gif)


Stopwatch summary
Analyse race tactics with stopwatch data
The data gathered by the stopwatch is presented in a table. This would, at the least, contain the time, distance and rating for each interval. However, you can configure it to contain other data gathered, such as the powers and arc lengths. This presents a numerical measure to the coach against which other performances can be compared.
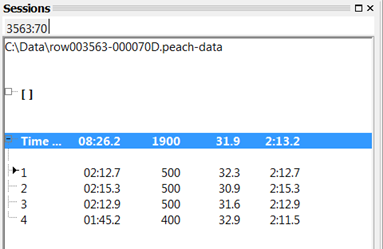
The stopwatch summary above shows the data collected from a 1000m piece where the logger had been set up to insert intervals every 250m. The top row (highlighted in blue) shows the total piece statistics and the four following rows show the breakdown for each 250m interval. From the left, there are columns for time, distance, average speed, rating, and power for the crew and each crew member.
If the coach wishes to indulge even more technical analysis, the software can present derived data, such as the standard deviation. This can be useful to gain a numerical measure of consistency for each rower.