Rower reports
View the 'signature' of rowing technique
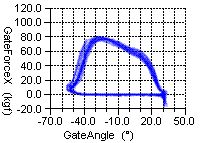
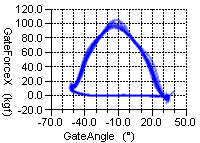
The most immediate way of evaluating technique and performance is to use rower reports. These can be printed out within minutes of the end of an outing. The main part of the report presents force curves plotted against angle, one per rower.
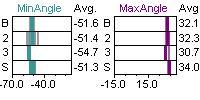
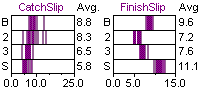
The reports can also show a variety of other performance measurements in bar graph format, such as catch angle, finish angle, boat speed, rating etc… In fact, the reports can be configured to plot anything against anything else – for example: boat speed against rating, to analyse optimum race pace.
The shape of a force vs. angle curve represents the technique of an athlete, and therefore tends to remain the same until technique is changed. This holds regardless of rating or crew composition and, for this reason, many coaches refer to these curves as ‘signatures’. This is immensely helpful, as a coach therefore has a stable basis for coaching an individual – “your curve currently looks like this, I want it to change to this…”
With experience, the coach will be able to able to relate the shape of these curves to typical standard problems:
- differences in strength, shown by area under the graphs;
- slow application in force;
- working the blade into the water;
- discontinuities in sequencing the legs, back and arms;
- dragging the blade in the water at the finish;
- etc...

This curve shows the blade being rowed in: there's no power in the middle of the stroke

Nice curve!

3 needs to adjust his stretcher back a couple of notches

Bow and stroke are falling off their finishes
.gif)

